
Intelligent Management of Distributed Energy Resources.Smarter Grids.
Empowering businesses, utilities and international organisations with smarter monitoring of distributed energy resources, intelligent control, battery optimisation and measurable environmental insights.
- Monitor
- Control
- Optimise
- Sustain
Connect thousands of homes, businesses and industrial sites to the grid. Safely, securely, under control.
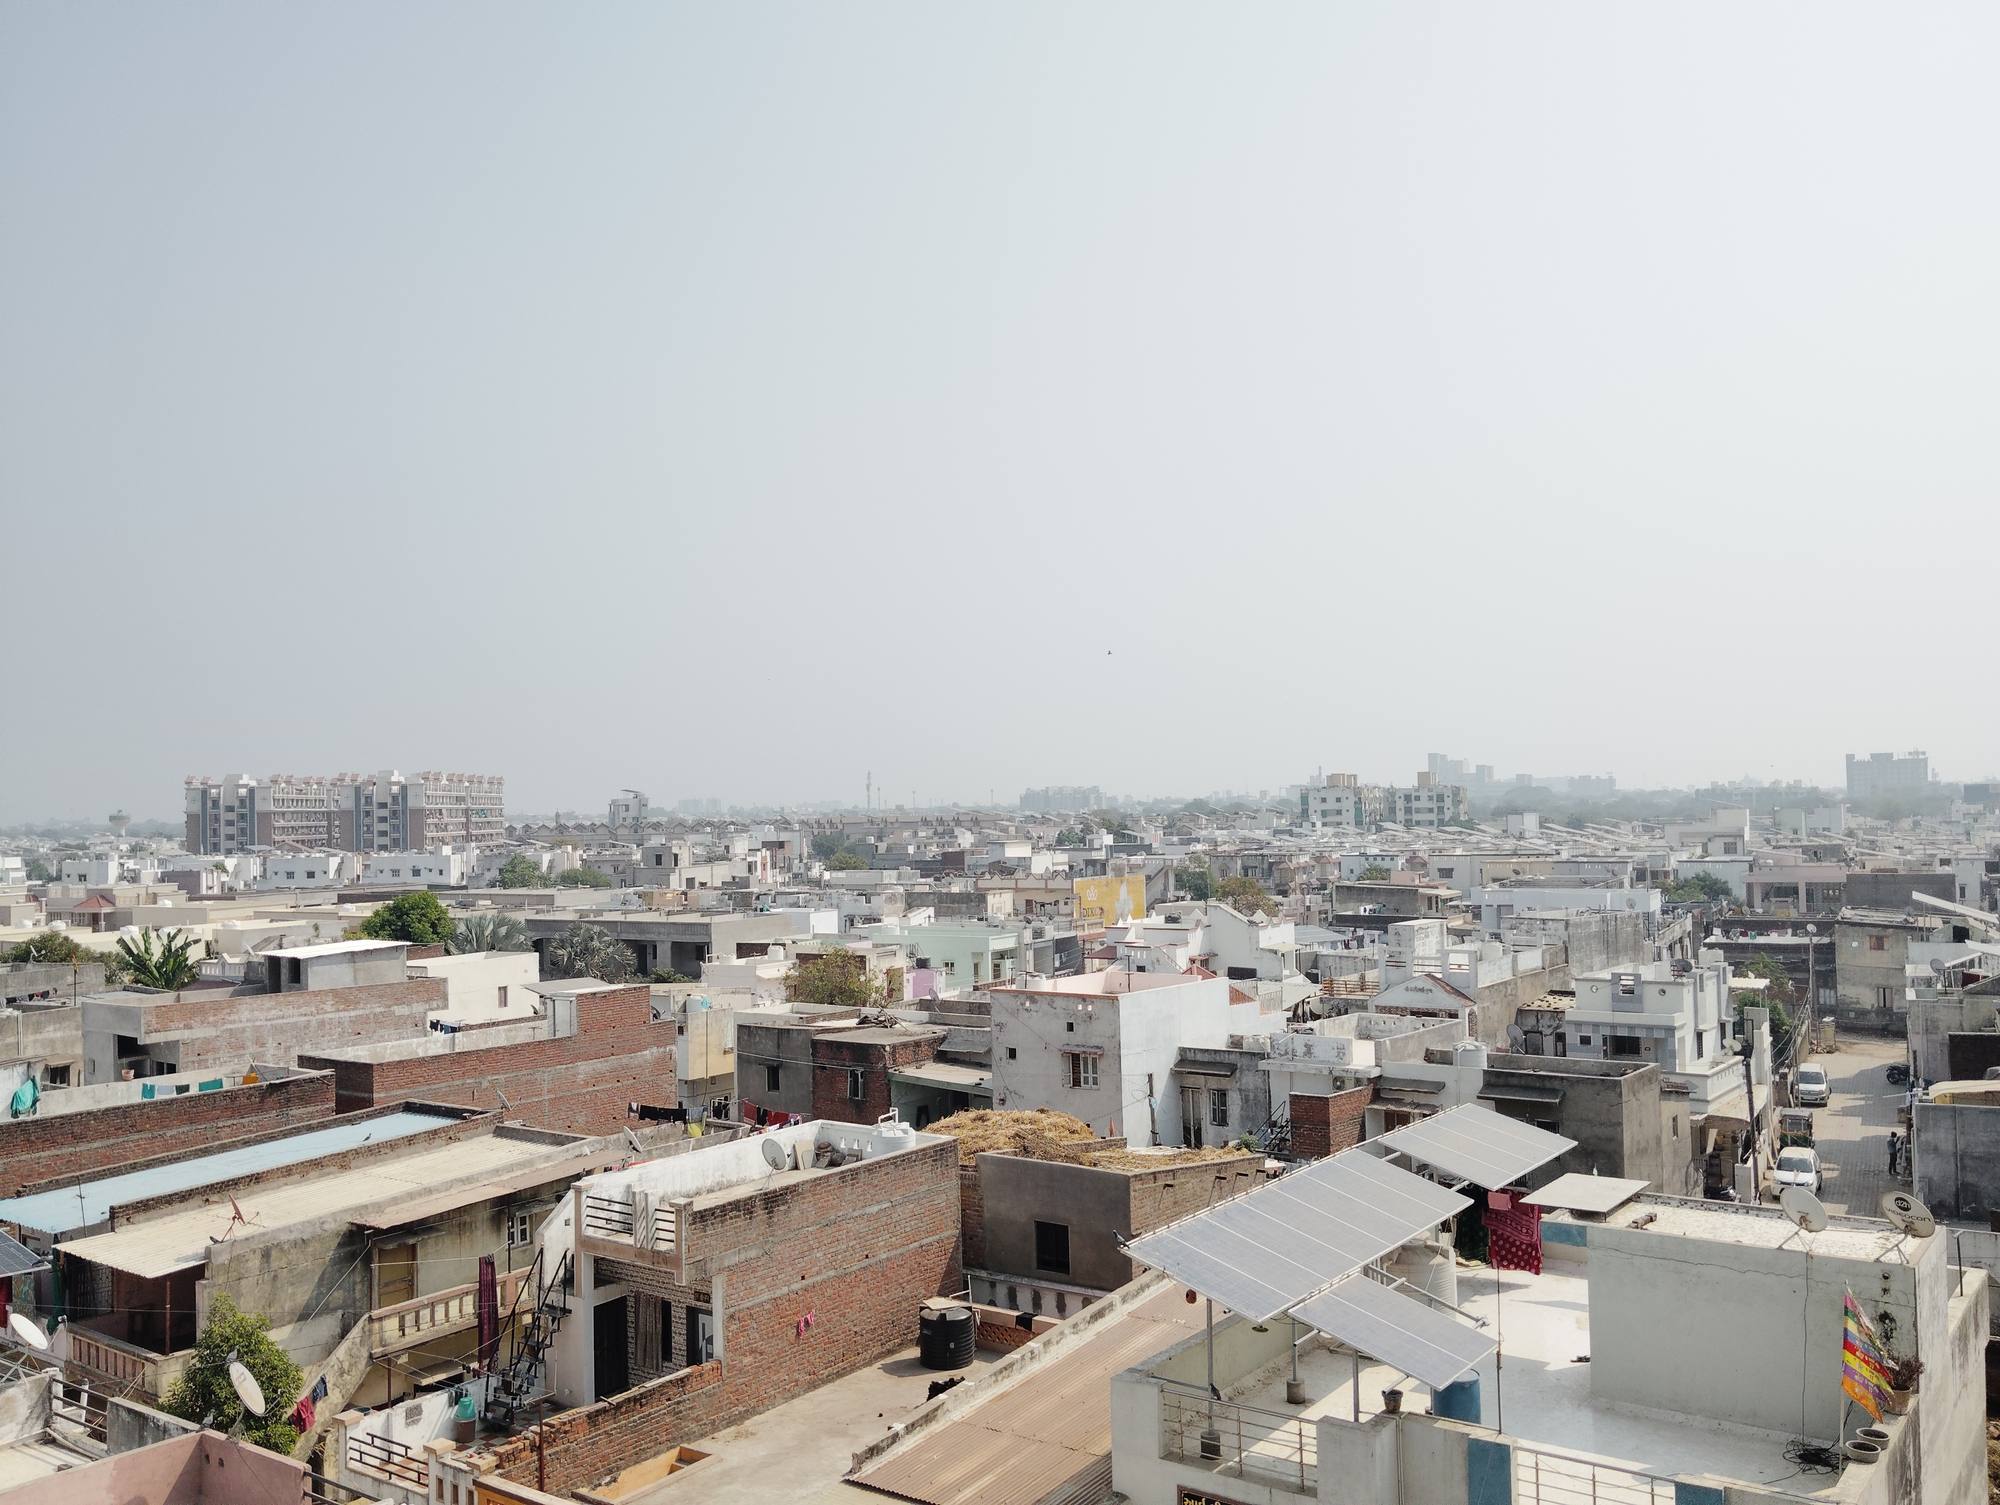
The Utility Integration Server lets an electricity company or national energy authority bring rooftop solar, batteries and other distributed energy resources into network operations at scale. Every device is identified, visible and able to follow the limits the network sets, so customers can export more and the grid can host more clean energy.
A conservative fixed cap protects the network on its worst day, but wastes clean energy every other day.
Illustrative example for one home on a sunny day. Actual results depend on the network and each programme's rules.
Thousands of connected homes, businesses and industrial sitesIllustrative
Designed to coordinate thousands of distributed energy resources across many equipment brands.
Export limits that follow network conditions, rather than fixed conservative caps.
Certificate-based identity using public key infrastructure, and encrypted communication between every device and the utility server.
One platform. Four very different missions.
Every organisation invests in solar and other distributed energy resources for its own reasons. We start from yours.
Electricity Utilities
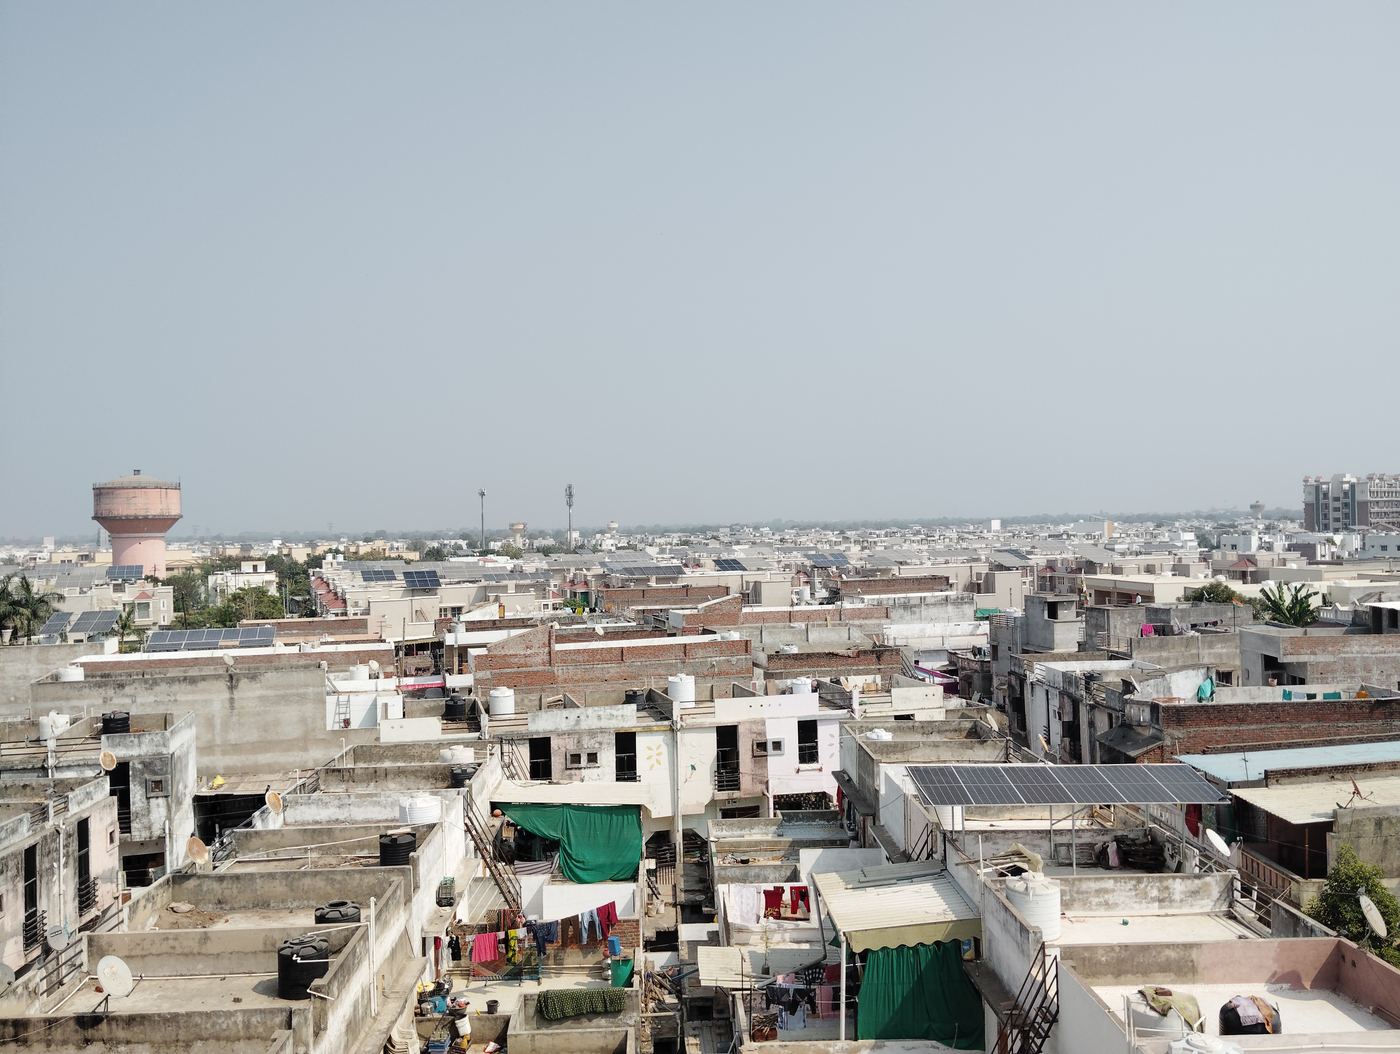
Fast-growing rooftop solar and batteries that the network can neither see nor coordinate, putting pressure on voltage and capacity.
Learn more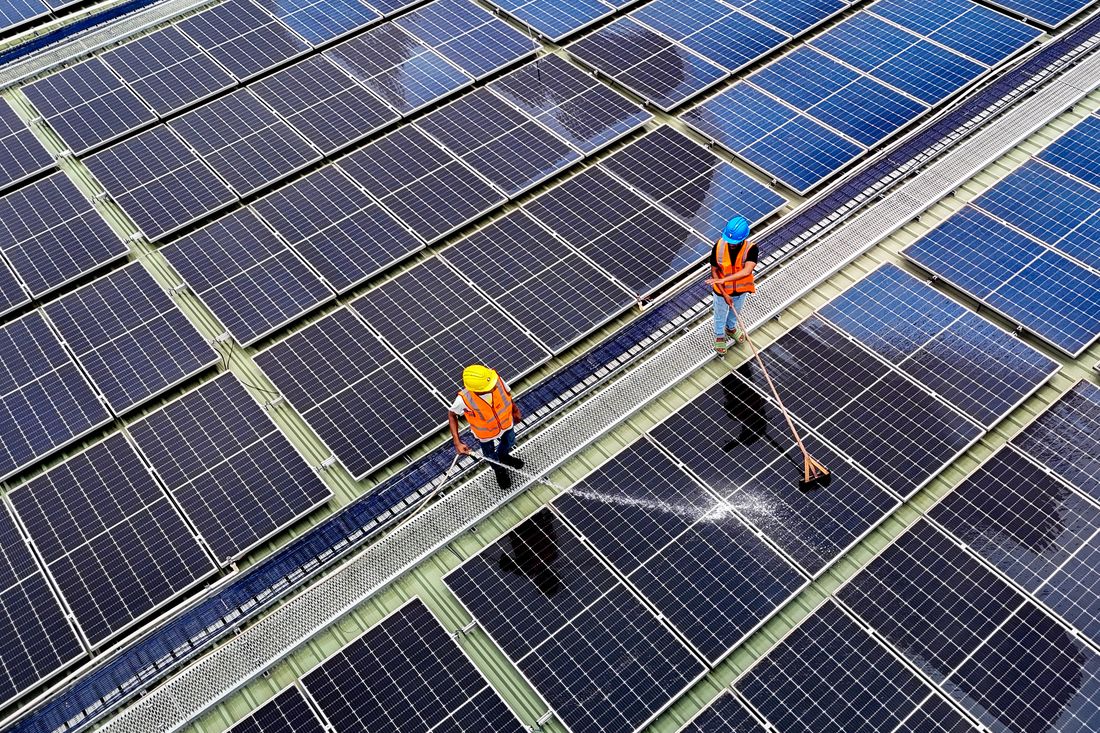
Commercial & Industrial
Rising electricity and fuel costs, peak demand charges and solar and battery assets that are rarely run to their potential.
Learn more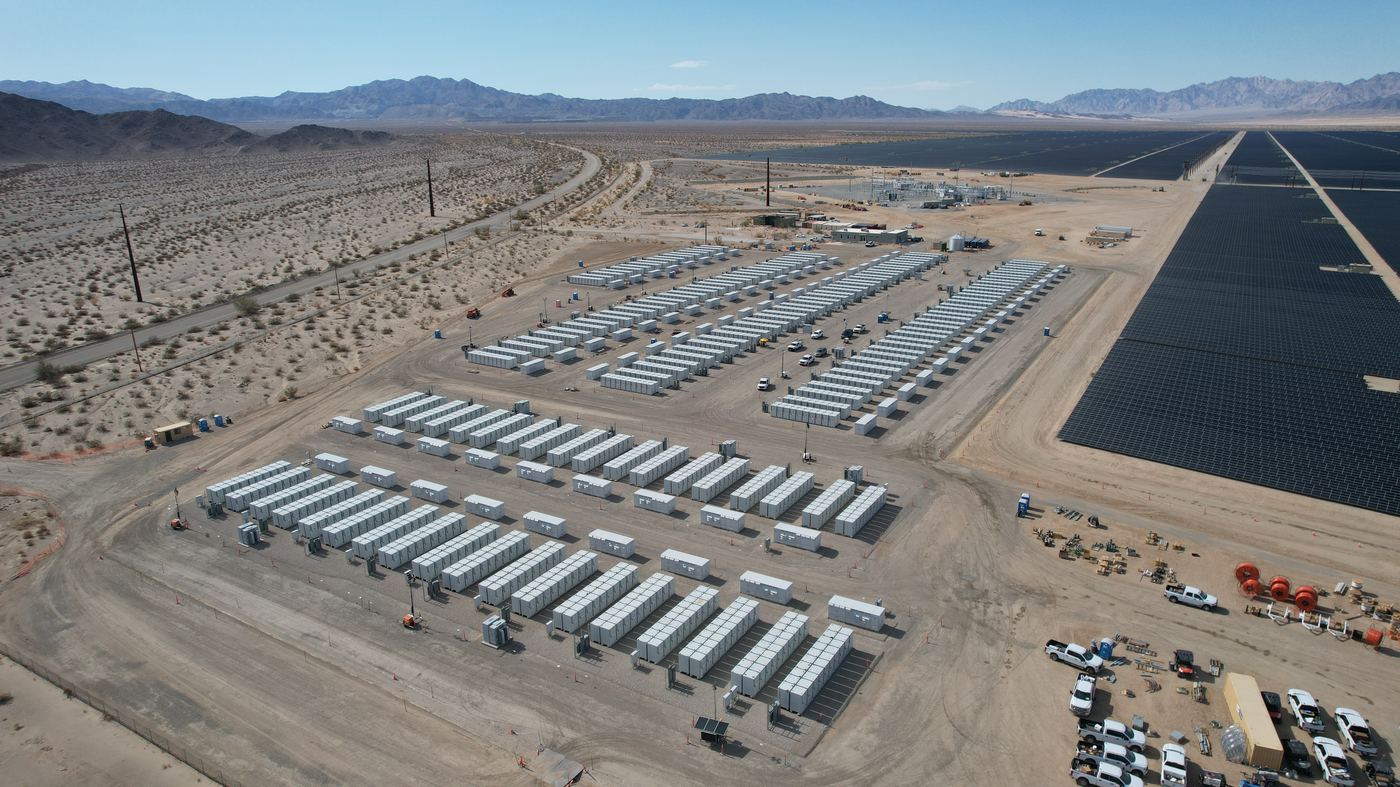
Microgrids & Remote Operations
Diesel generators running harder than they need to, expensive fuel logistics and sites that are hard to reach when something fails.
Learn more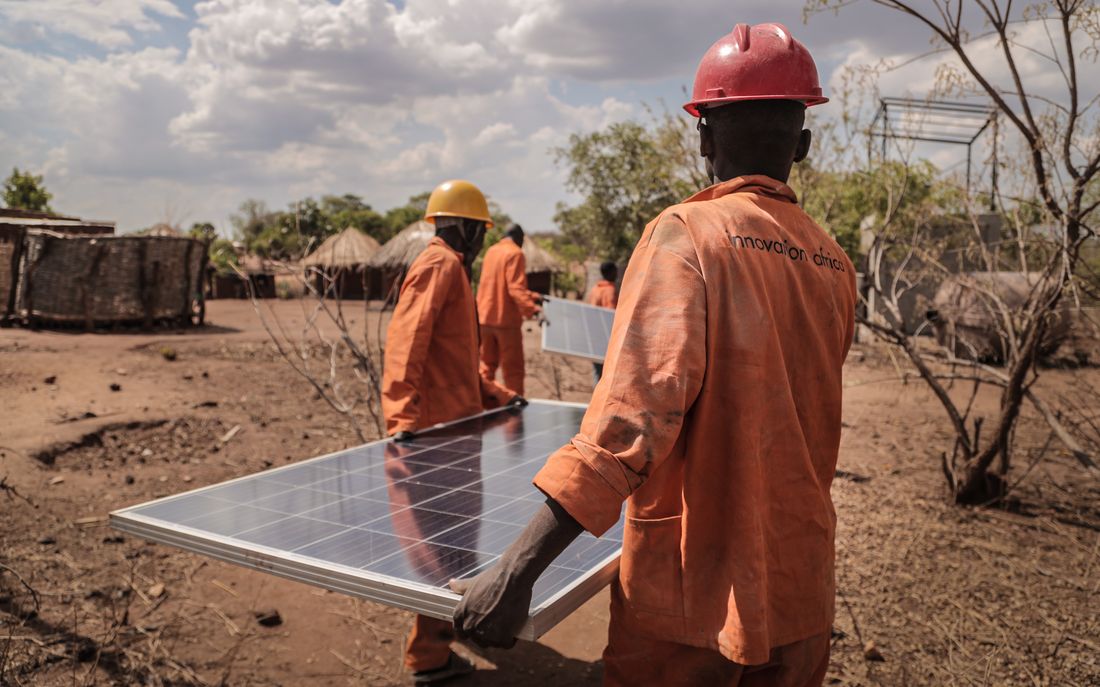
UN Agencies & Humanitarian Organisations
Field offices and clinics that depend on diesel, with little visibility across countries and growing pressure to show measurable environmental progress.
Learn moreFrom visibility to intelligent control.
Seven capabilities that work together, so you can start where you need to and grow from there.
Utility Server & Grid Integration
Secure, standards-based coordination between distributed energy resources and network operations.
Artificial Intelligence-Driven Battery Optimisation
Machine learning forecasts of load and solar decide when the battery charges and discharges.
Distributed Energy Resources Monitoring & Analytics
Real-time and historical visibility of generation, consumption, storage and equipment health across every site.
Smart Control of Distributed Energy Resources
Move from watching to acting: schedules, export limits and coordinated control of mixed-brand equipment.
Edge Energy Controller
A compact on-site controller that talks to inverters, batteries and meters, and keeps working if connectivity drops.
Microgrid & Hybrid Energy Management
Coordinated solar, storage and generator operation for isolated and hybrid power systems.
Carbon & Sustainability Monitoring
Renewable share, fuel use and estimated emissions, with transparent assumptions you can stand behind.
Five layers. One connected system.
Each layer has one clear job. Commercial sites use the first three; utility integration is added only where a network operator is involved.
Select a layer to see what it does.
Distributed energy resources
The equipment you already own or plan to install, from different manufacturers.
Stored energy, used when it matters most.
A battery left on a standard rule charges only from surplus solar and discharges only to cover the load. Optimisation uses machine learning forecasts of site load, energy prices and the weather to plan every charge and discharge, and keeps adjusting through the day.
What the optimiser takes into account
- Solar production forecast
- Site electricity demand
- Battery state of charge
- Tariffs and time-of-use prices
- Peak demand and export limits
- Backup energy reserve
- Equipment operating limits
Illustrative Illustration of energy flows. Results depend on each site's equipment, tariffs and usage.
Renewable performance and emissions, side by side.
See how much renewable energy you generate, how much fuel you use and an estimate of the emissions behind both, with every number labelled for what it is.
Last 12 months · all sitesDemonstration data
Measured
Measured
Estimated
Estimated
Estimated
Monthly renewable energy and estimated emissions
Renewable share by site
Every figure says what it is
Read directly from meters, inverters, batteries or fuel sensors.
Calculated from measurements, such as fuel displaced by solar, with the method shown.
Emissions calculated with stated emission factors and baselines, not certified results.
Every site, every country, one view.
Industrial groups, utilities and international organisations rarely run one site. A central platform brings generation, storage, consumption, alerts and sustainability metrics for every location into one place, so teams can compare performance and act where it matters.
- Portfolio overview
- Site performance and asset health
- Alerts and fault notifications
- Comparative and sustainability reporting
| Site | Region | Solar today | Battery | Status |
|---|---|---|---|---|
| Field office A | East Africa | 18.4 kWh | 82% | Normal |
| Clinic B | Horn of Africa | 26.1 kWh | 64% | Normal |
| Warehouse C | North Africa | 141 kWh | 47% | Inverter alert |
| Operations centre D | Gulf | 312 kWh | 71% | Normal |
| Mine camp E | West Africa | 904 kWh | 58% | Normal |
Illustrative Illustrative portfolio. Site names and figures are examples only.
Built to connect, built to last.
Vendor independent
Works across many inverter, battery and meter brands, so you are not locked into one supplier.
Secure communications
Encrypted connections and certificate-based device identity from the site to the cloud.
Works with your existing systems
Designed to complement the control rooms, management systems and equipment you already run.
Scalable architecture
From a single facility to fleets of sites across several countries.
Let's build a smarter, more sustainable energy future.
Tell us about your sites and goals. Our team will come back with a clear next step.